It's now at -2.1%.Atlanta Fed says - 1% for Q2. Here we go.
GDPNow- Federal Reserve Bank of Atlanta
www.atlantafed.org
-
Ever wanted an RSS feed of all your favorite gaming news sites? Go check out our new Gaming Headlines feed! Read more about it here.
-
We have made minor adjustments to how the search bar works on ResetEra. You can read about the changes here.
Stock Market Era |OT3| Nobody expects the Spanish Inflation!
- Thread starter Sheepinator
- Start date
- OT
You are using an out of date browser. It may not display this or other websites correctly.
You should upgrade or use an alternative browser.
You should upgrade or use an alternative browser.
Hmm...after hours stealth update on a Friday? Hope the market don't dump on Tuesday🤡
Hmm...after hours stealth update on a Friday? Hope the market don't dump on Tuesday🤡
We might be in for a hell of a bad week. D:
this was known early yday and the market still pumped into close. I am hoping tuesday isnt like the tuesday after MDW where we went up on friday and crashed to new lows the tuesday
We had three day weekend heading into close on Friday, normally good for a pump. A shortened holiday week can be good for a move higher too, but I think we have data this week that can move markets. Job data on Friday I believe? Maybe some Fed stuff mid week.
At the same time, use the extra time this weekend to start hunting for individual stocks for trades. Now that we are in the midst of most everyone accepting we are heading to recession, and the data starting to show we are in the middle of at least a big slowdown, I've been actively looking for stocks that might show signs of reversal. Since individual stocks will normally turn before the major indexes.
But don't play hero ball here either. Just begin with starter positions and see if they are working before adding more. Take a look at the weekly AMD and Nvidia charts why you don't necessarily want to go in hard on the initial buy, unless you are going for a quick bounce trade. These stocks bounced for a couple weeks and now made new weekly closing lows. Time to reset and look again to see at what level they can hold a sustainable rally.
Nvidia weekly chart is now coming into a zone where it consolidated, alongside the all time 61.8% retracement level and a 200 week moving average below. There are multiple reason why it could start holding around 115 to 130, if/when it gets this low.

AMD is close to falling out of it's weekly consolidation zone at the moment, so these consolidation areas aren't guarantees to hold. To be fair to AMD though, it hasn't fallen out yet. But it's close. AMD almost literally to the penny on the spot it has held over and over in the past two years.

AMD does have a 200 week moving average coming into play here, with another 61.8% all time retracement level and another consoildation zone just underneath. So another possible bounce spot. I think I've said this already, but I'll be getting more interested in AMD if it can get into the high 50s. Though again it will only be with a starter position. Since a lot of this likely depends on how deep a recession the big hedge funds think we will go into. Smaller, shorter recession, likely closer to lows. Deeper recession, then we probably have one more big flush lower to go. Oh and if the federal reserve actually breaks something too in their overly late quest to tame inflation.
At the same time, use the extra time this weekend to start hunting for individual stocks for trades. Now that we are in the midst of most everyone accepting we are heading to recession, and the data starting to show we are in the middle of at least a big slowdown, I've been actively looking for stocks that might show signs of reversal. Since individual stocks will normally turn before the major indexes.
But don't play hero ball here either. Just begin with starter positions and see if they are working before adding more. Take a look at the weekly AMD and Nvidia charts why you don't necessarily want to go in hard on the initial buy, unless you are going for a quick bounce trade. These stocks bounced for a couple weeks and now made new weekly closing lows. Time to reset and look again to see at what level they can hold a sustainable rally.
Nvidia weekly chart is now coming into a zone where it consolidated, alongside the all time 61.8% retracement level and a 200 week moving average below. There are multiple reason why it could start holding around 115 to 130, if/when it gets this low.
AMD is close to falling out of it's weekly consolidation zone at the moment, so these consolidation areas aren't guarantees to hold. To be fair to AMD though, it hasn't fallen out yet. But it's close. AMD almost literally to the penny on the spot it has held over and over in the past two years.
AMD does have a 200 week moving average coming into play here, with another 61.8% all time retracement level and another consoildation zone just underneath. So another possible bounce spot. I think I've said this already, but I'll be getting more interested in AMD if it can get into the high 50s. Though again it will only be with a starter position. Since a lot of this likely depends on how deep a recession the big hedge funds think we will go into. Smaller, shorter recession, likely closer to lows. Deeper recession, then we probably have one more big flush lower to go. Oh and if the federal reserve actually breaks something too in their overly late quest to tame inflation.
Last edited:
All I can do is just keep buying with each paycheck. Because when the market eventually recovers, I'd be kicking myself if I didn't.
I only see it down 6%, but Biden is going to Saudi Arabia.
OP
OP
Is it possibly because of the Ukraine war? Putin appears to have claimed victory over the eastern provinces and seems to be pausing, saying they open to negotiations provided Ukraine gives them absolutely everything he wants. Of course Ukraine said hell no.
Seriously. Other than my TSLA and MGK holdings, everything else was red, but those two made me come out green for the day.
A part this
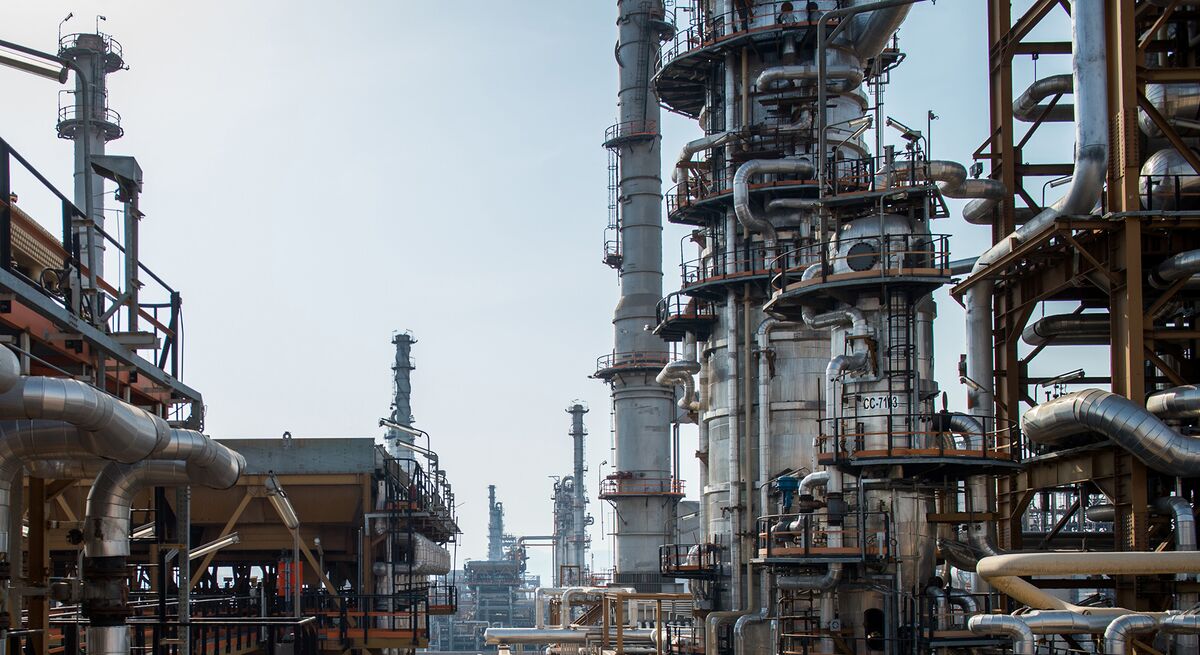
Iran Slashes the Cost of Its Oil to Compete With Russia in China
Iran is being forced to discount its already cheap crude even more as a top ally gains a bigger foothold in the key Chinese market.
 www.bloomberg.com
and a part reduced demand brought on by a possible upcoming recession?

CNBC: Oil tumbles below $100 a barrel as recession fears mount
https://www.cnbc.com/2022/07/05/oil-tumbles-more-than-8percent-breaks-below-100-as-recession-fears-mount.html
 www.resetera.com
Yeah, that is.. interesting? Quite a noticeable few minutes there. Leaks on FOMC? Its just meeting notes from June though right?
Hey, I'm not sure where else to ask this so I thought I'd try here.
I have a Brokerage Account with Vanguard and I see they are overhauling their UI for the various mutual fund pages. You still have the option to look at "the old style" but that's going away soon. My question is, how come in the new UI they got rid of the "hypothetical 10 year graph with a deposit of 10k" chart?
I have a Brokerage Account with Vanguard and I see they are overhauling their UI for the various mutual fund pages. You still have the option to look at "the old style" but that's going away soon. My question is, how come in the new UI they got rid of the "hypothetical 10 year graph with a deposit of 10k" chart?
Glad we can finally see this meltdown in action. The apes all think they are getting some free money glitch where the stock price stays the same, but they receive more shares as a dividend.
Didn't the job numbers beat expectations yesterday? Maybe this bounce is solid.
I didn't see any numbers yesterday, but unemployment claims were higher than expected. Less jobs, stocks go up!Didn't the job numbers beat expectations yesterday? Maybe this bounce is solid.
and this is why I'm thinking of getting another sell call
Make no mistake, one bad news day and everything will tank 10% again.I regret not getting more Google. I guess I was just waiting for it to touch closer to $2K (last time I bought quite a bit was around this level). I was most recently buying AMD at $73-74ish and NVDA at $150ish though.
OP
OP
LOL. The "seasoned technology industry finance executive, who spent more than 17 years at Amazon supporting growth across global..." only lasted one year. The previous CFO lasted less than two years. I wonder how many more CFO's we'll get before we get a business plan and any fiscal guidance.
LOL. The "seasoned technology industry finance executive, who spent more than 17 years at Amazon supporting growth across global..." only lasted one year. The previous CFO lasted less than two years. I wonder how many more CFO's we'll get before we get a business plan and any fiscal guidance.
But stock split go up
I regret not getting more Google. I guess I was just waiting for it to touch closer to $2K (last time I bought quite a bit was around this level). I was most recently buying AMD at $73-74ish and NVDA at $150ish though.
Make no mistake, one bad news day and everything will tank 10% again.
"Stairs up, elevator down" is the best way to describe this stonk market right now 🤡
You still might have a chance after the stock splits on July 15. Sometimes there's a runup to day before the split and sometimes sells off the day after (if there's a runup). Because there is CPI data releasing on July 13, we might see some elevator action through that weekend if the numbers are worse than expected. Or it could just be a nothing burger.
Probably because the information it gives isn't substantially different from the 10-year price chart on the current interface. If something started at $200 in July 2012, and was $300 in August 2016, that's a gain of 50%. If it had instead started at $10,000 in July 2012, the same 50% gain would result in it being $15,000 in August 2016.My question is, how come in the new UI they got rid of the "hypothetical 10 year graph with a deposit of 10k" chart?
Another .75% rate hike, let's go!
That'll be more dependent on the CPI read next week, but this does give Powell carte blanche.
That'll be more dependent on the CPI read next week, but this does give Powell carte blanche.
I think it's going to happen anyway. It might be the same situation like last month where .5% is not aggressive enough (stonks down) and .75% was expected (stonks down).