-
Ever wanted an RSS feed of all your favorite gaming news sites? Go check out our new Gaming Headlines feed! Read more about it here.
Media Create Sales: Week 1, 2019 (Dec 31 - Jan 06)
- Thread starter Chris1964
- Start date
You are using an out of date browser. It may not display this or other websites correctly.
You should upgrade or use an alternative browser.
You should upgrade or use an alternative browser.
I don't see it reaching 20M if there is indeed a 3D Zelda in 2020 (King Zell hinted at this). If that's not the case, then it might have a chance, but even then, that sounds a little high: it's an evergreen, but one that sells much less than others (especially less than MK8D)
True.
It'll be interesting to see how much the game sold last quarter. It might well be close to 12m.
Breath of the Wild Switch in this graph actually includes Switch and Wii U numbers, last we know Switch BotW is at 10.28 million at the end of Semptember 2018.What Botw is already the best selling Zelda?? is this really correct?
The others are not combined sales of releases and re-releases, so this graph is a little bit misleading. Whats true is that Switch BotW is the single best selling Zelda release with 10.28 million, followed by Twilight Princess. Highest combined Zelda with rerelease is Orcarina of time with 13.22 million.
Still absolutely stellar franchise growth.
I don't see it reaching 20M if there is indeed a 3D Zelda in 2020 (King Zell hinted at this). If that's not the case, then it might have a chance, but even then, that sounds a little high: it's an evergreen, but one that sells much less than others (especially less than MK8D)
you know that there was a Wiiu version and the total sales are probably already around 15m right?
Nah, Switch is at 10.28, Wii U was last reported at 1.5, might be 2 now but not more. 20 million is very unlikely.you know that there's a Wiiu version and the total sales are probably already around 15m right?
https://www.nintendo.co.jp/ir/en/finance/software/index.html
https://www.nintendo.co.jp/ir/en/finance/software/wiiu.html
Edit: Added links.
Prediction time. :^)Week 2 drop will give a very good idea how things will turn this quarter for hardware.
Week 2 2018
PS4 - 43.808
NSW - 37.500
PS4 - 40K
NSW - 40K
Because enough spending has happened.
And no, I'm really not good at prediction. I'm just having fun.
Nah, Switch is at 10.28, Wii U was last reported at 1.5, might be 2 now but not more. 20 million is very unlikely.
https://www.nintendo.co.jp/ir/en/finance/software/index.html
https://www.nintendo.co.jp/ir/en/finance/software/wiiu.html
Edit: Added links.
those are sales as september. last year q3 it sold 1,9m
switch version is probably at 12 right now. 20m is very likely especially with a low price Lines in the future
Breath of the Wild Switch in this graph actually includes Switch and Wii U numbers, last we know Switch BotW is at 10.28 million at the end of Semptember 2018.
The others are not combined sales of releases and re-releases, so this graph is a little bit misleading. Whats true is that Switch BotW is the single best selling Zelda release with 10.28 million, followed by Twilight Princess. Highest combined Zelda with rerelease is Orcarina of time with 13.22 million.
Still absolutely stellar franchise growth.
It's is not misleading in the slightest. Breath of The Wild on this graph doesn't include re-release.
It released day and date on Switch & Wii U therefor it makes sense to combine them just like everyone else does with Smash on Wii U & 3DS.
OP
OP
Combining Smash on Wii U and 3DS doesn't make a lot of sense either.It's is not misleading in the slightest. Breath of The Wild on this graph doesn't include re-release.
It released day and date on Switch & Wii U therefor it makes sense to combine them just like everyone else does with Smash on Wii U & 3DS.
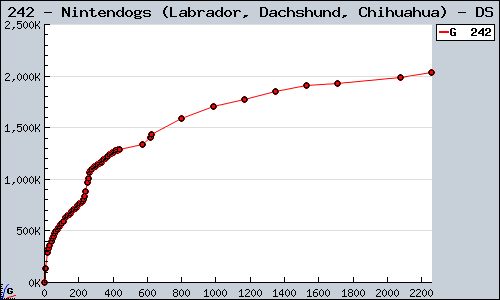
Garaph data is increasingly incomplete, but this one looks strong. Released April 2005. By Famitsu's count crossed the barrier sometime in the first half of 2011.We marvel at how fast some games sell, but I wonder what the slowest to 2 million is.
The biggie is probably that Media Create numbers start 2002, but PS2 launched in 2000.I am confused, isn't ps2 ltd like 22M? These yearly sales don't add up to that number.
Japanese third parties looking at those Switch HW and SW sales like
Isn't it a little late for those not already in though? PS5 might not be that far away into the future, sure obviously not this year but 2020?
PS4's drop will be extra harsh because it's also going to be the end of that promotion period.
Oh so it was a temporal thing.
I'm confused, what's on the x axis ? Days ?Garaph data is increasingly incomplete, but this one looks strong. Released April 2005. By Famitsu's count crossed the barrier sometime in the first half of 2011.
It's is not misleading in the slightest. Breath of The Wild on this graph doesn't include re-release.
It released day and date on Switch & Wii U therefor it makes sense to combine them just like everyone else does with Smash on Wii U & 3DS.
Still listing BotW Switch and Wii U seperatly while combining sales under BotW Switch is slightly weird.
This is what I've always thought, that they would cut the price down on the current model and introduce a pro type model for $300.It's not like a 3DSXL or 2DS are pocketable as-is (I know you were comparing OG GBA but even that isn't super duper portable) but those did alright. Taking the joycons off makes the switch super easy to carry around and a lot smaller so a version with fixed joycons would be less portable than it currently is.
I'm on the boat thinking you keep making this version of the Switch but cut the price 50-100 bucks and get a new Switch out with a better processor for $300. It makes the most logical sense.
The one thing is I think they want to phase this current revision out cause of the hardware/hacking flaw. But seeing the software sales, I wouldn't pay the hacking shit any mind if I was Nintendo. Let it be, it's not affecting sales at all
Yeah, the software sales we see here certainly aren't making Nintendo bite their nails over pirates. I do wonder if they'd make a revision on a smaller node to help with battery life on a theoretical cheaper version since no one wants to make 20nm chips anymore.This is what I've always thought, that they would cut the price down on the current model and introduce a pro type model for $300.
The one thing is I think they want to phase this current revision out cause of the hardware/hacking flaw. But seeing the software sales, I wouldn't pay the hacking shit any mind if I was Nintendo. Let it be, it's not affecting sales at all
Top Yearly Performances (Famitsu, >500k):
Note! The Nintendo Switch sales are pretty comparable to the 6th Gen top performers.
GBA and PS2 both launched in march. After year 4 the GBA sales faltered quickly because of the DS launch while the PS2 was an evergreen console.
Nintendo noted that they want to extend the life for the Switch for as long as possible. This is in line with Nintendos recent efforts to extend the life of the 3DS although this was quite a diffcult task due to its already at launch dated hardware and its low screen resolution. The 3DS hardware was never valued highly by consumers hence the early price cut. In contrast to the 3DS the Switch hardware is appreciated by consumers and with its screen consumers can enjoy cinematic experiences.
For these reasons i think the NSW sales should be measured by the PS2 sales because they were steady and the PS2 was long supported.There is also no other way for the Switch to achieve 20 million console sales in japan. The last two years the Switch achieved good results reaching nearly the same levels as the PSP in their best year on the back of the Monster Hunter hype.
In the next year the Switch should achieve between 3.732.020 and 3.833.980 sales as the PS2 and the GBA did, below is bad and above is good. The 3DS achieved 4,931,509 sales in its third year but as I explained above the 3DS should be (hopefully) more fontloaded than the Switch.
Next year could also be the peak year for the Switch so hopefully the NSW gets into the top 10 of the chart below. The NSW needs to sell 4,025,313 units at minimum. The best case would be to outperform place 7 with 4,200,311 units sold.
Comparison GBA/PS2/NSW:
By yearly sales:
01. DS (2006) 8,862,969
02. DS (2007) 7,143,702
03. 3DS (2012) 5,626,763
04. PS1 (1997) 5.193.055
05. 3DS (2013) 4,931,509
06. PS1 (1998) 4.514.775
07. GBA (2001) 4.210.317 (launch / weeks of data)
08. 3DS (2011) 4,135,739 (launch / 44 weeks of data)
09. DS (2008) 4,029,804
10. DS (2009) 4,025,313
11. DS (2005) 4,002,871
12. GBA (2003) 3.833.980
13. PS2 (2002) 3.732.020
14. WII (2007) 3,629,361
15. PSP (2008) 3,543,171
16. NSW (2018) 3.482.388
17. NSW (2017) 3.407.158 (launch / weeks of data)
18. GBA (2002) 3,366,723
19. PS2 (2001) 3.246.138
20. PS2 (2003) 3.211.975
21. 3DS (2014) 3.153.045
22. PSP (2007) 3,022,659
23. PS2 (2000) 3,016,622 (launch / weeks of data)
24. DS (2010) 2,963,709
25. PS1 (1999) 2.927.856
26. WII (2008) 2,908,342
27. PSP (2010) 2,890,476
28. PS2 (2004) 2.729.237
29. PS1 (1996) 2.689.095
30. GBA (2004) 2.436.106
31. PSP (2009) 2,307,971
32. GBC (1999) 2.261.756
33. PSP (2005) 2,225,799
34. 3DS (2015) 2.189.900
35. GBC (2000) 2,097,899
36. PS2 (2005) 2.020.184
37. WII (2009) 1,975,178
38. PSP (2011) 1,960,177
39. PSP (2006) 1,946,911
40. PS4 (2017) 1.935.247
41. 3DS (2016) 1.874.457
42. 3DS (2017) 1.827.131
43. PS4 (2016) 1.790.883
44. WII (2010) 1,728,293
45. PS3 (2009) 1,727,041
46. PS4 (2018) 1.695.227
47. PS3 (2010) 1,558,480
48. PS2 (2006) 1.470.654
49. PS3 (2011) 1,467,261
50. PS1 (1995) 1.370.000
51. PS3 (2012) 1,327,185
52. N64 (1998) 1.208.070
53. PS3 (2007) 1,206,347
54. PS4 (2015) 1.205.163
55. PSV (2013) 1,197,980
56. GBA (2005) 1.197.061
57. GC (2003) 1.155.122
58. PSV (2014) 1.147.938
59. N64 (1999) 1.131.605
60. DS (2004) 1,095,930 (launch / 4 weeks of data)
61. GC (2002) 1,034,484
62. PS3 (2008) 991,303
63. WII (2006) 989,118 (launch / 5 weeks of data)
64. PSV (2015) 959.342
65. PSP (2012) 941,992
66. WII (2011) 937,451
67. N64 (1996) 933.480 (launch / weeks of data)
68. SDC (1999) 932.761
69. GC (2001) 925,924 (launch / weeks of data)
70. PS4 (2014) 925.570 (launch / weeks of data)
71. N64 (1997) 919.269
72. WIU (2013) 880,088
73. GBC (1998) 855.175
74. PSV (2016) 865.002
75. PS3 (2013) 824,167
76. WIU (2015) 820.304
77. PS2 (2007) 816,419
78. DS (2011) 711,204
79. PSV (2012) 674,365
80. WIU (2012) 638,339 (launch / 4 weeks of data)
81. WIU (2014) 604.856
82. PS1 (2000) 581,260
83. 3DS (2018) 566.420
84. GC (2004) 535.961
85. GBC (2001) 529.452
Note: Missing Famitsu Data from "Game Data Library"
Note! The Nintendo Switch sales are pretty comparable to the 6th Gen top performers.
GBA and PS2 both launched in march. After year 4 the GBA sales faltered quickly because of the DS launch while the PS2 was an evergreen console.
Nintendo noted that they want to extend the life for the Switch for as long as possible. This is in line with Nintendos recent efforts to extend the life of the 3DS although this was quite a diffcult task due to its already at launch dated hardware and its low screen resolution. The 3DS hardware was never valued highly by consumers hence the early price cut. In contrast to the 3DS the Switch hardware is appreciated by consumers and with its screen consumers can enjoy cinematic experiences.
For these reasons i think the NSW sales should be measured by the PS2 sales because they were steady and the PS2 was long supported.There is also no other way for the Switch to achieve 20 million console sales in japan. The last two years the Switch achieved good results reaching nearly the same levels as the PSP in their best year on the back of the Monster Hunter hype.
In the next year the Switch should achieve between 3.732.020 and 3.833.980 sales as the PS2 and the GBA did, below is bad and above is good. The 3DS achieved 4,931,509 sales in its third year but as I explained above the 3DS should be (hopefully) more fontloaded than the Switch.
Next year could also be the peak year for the Switch so hopefully the NSW gets into the top 10 of the chart below. The NSW needs to sell 4,025,313 units at minimum. The best case would be to outperform place 7 with 4,200,311 units sold.
Comparison GBA/PS2/NSW:
Launch dates:
NSW: March 3, 2017
PS2: March 4, 2000
GBA: March 21, 2001
GBA:
Year 1: 4.210.317
Year 2: 3,366,723
Year 3: 3.833.980
Year 4: 2.436.106
Year 5: 1.197.061
Year 6: 407.341
PS2:
Year 1: 3,016,622
Year 2: 3.246.138
Year 3: 3.732.020
Year 4: 3.211.975
Year 5: 2.729.237
Year 6: 2.020.184
Year 7: 1.470.654
Year 8: 816,419
Year 9: 480,664
NSW:
Year 1: 3.407.158
Year 2: 3,400,000
PSP:
Year 1: 339,944
Year 2: 2,225,799
Year 3: 1,946,911
Year 4: 3,022,659
Year 5: 3,543,171
Year 6: 2,307,971
Year 7: 2,890,476
Year 8: 1,960,177
Year 9: 941,992
Year 10: 429,393
Last edited:
Correct, days since game launch. It's the sort of thing that makes more sense when looking at early numbers and not thousands of days.
PS4's drop will be extra harsh because it's also going to be the end of that promotion period.
Agreed, Probably will be sub 20k already.
I'm not expecting a big bump for KH3 and RE2 either. Around ~50k.
HW yearly sales recap since 2002 (Media Create)
2006:
NDS - 8.358.724
2007:
NDS - 7.167.372
Holy ffff...!!!
Btw, I remember when ppl said Kimishima were crazy saying that switch could do wii numbers
Isn't it a little late for those not already in though? PS5 might not be that far away into the future, sure obviously not this year but 2020?
I don't really think the PS5 is going to affect Switch support by Japanese developers in any meaningful way.
Holy ffff...!!!
Btw, I remember when ppl said Kimishima were crazy saying that switch could do wii numbers
Yeah I remember that too. I think he said it before launch and man people were mocking him like crazy considering how negative everyone was before launch.
Okay. Why is media create tracking switch significantly lower than the other two? 30k lower in week 51, 10+k lower in week 52, and now 47k lower than dengeki at least for week 1. That's an 87k discrepancy in a matter of 3 weeks.
Combining Smash on Wii U and 3DS doesn't make a lot of sense either.
I wouldn't call it misleading though, especially since BOTW released on Switch & Wii U together.
Hidemaro Fujibayashi said development began in January 2013.It started development well before it was announced; shortly after Skyward Sword released.
That trailer video didn't just poof into existence!
I'd say they should be combined as long as we're combining Twilight Princess and the Oracle games.It's is not misleading in the slightest. Breath of The Wild on this graph doesn't include re-release.
It released day and date on Switch & Wii U therefor it makes sense to combine them just like everyone else does with Smash on Wii U & 3DS.
Re-releases years later are completely different
Agreed, Probably will be sub 20k already.
I'm not expecting a big bump for KH3 and RE2 either. Around ~50k.
Should have kept at least price promotion going on until the big hitters release (KH and RE) to maximise their hw moving potential. oh well.
I wouldn't call it misleading though, especially since BOTW released on Switch & Wii U together.
smash Wii u and 3ds are different games
Switch looks a lot like the PS2, this year and the next are going to be great for it. 4 million should be feasible this year. Lower the price + new model + real Pokemon is going to be insane. Unlike previous Nintendo consoles, 3rd parties are filling the gaps here, and Nintendo is doing a great job at releasing quality software in a timely manner.Top Yearly Performances (Famitsu, >500k):
By yearly sales:
01. DS (2006) 8,862,969
02. DS (2007) 7,143,702
03. 3DS (2012) 5,626,763
04. PS1 (1997) 5.193.055
05. 3DS (2013) 4,931,509
06. PS1 (1998) 4.514.775
07. GBA (2001) 4.210.317 (launch / weeks of data)
08. 3DS (2011) 4,135,739 (launch / 44 weeks of data)
09. DS (2008) 4,029,804
10. DS (2009) 4,025,313
11. DS (2005) 4,002,871
12. GBA (2003) 3.833.980
13. PS2 (2002) 3.732.020
14. WII (2007) 3,629,361
15. PSP (2008) 3,543,171
16. NSW (2018) 3.482.388
17. NSW (2017) 3.407.158 (launch / weeks of data)
18. GBA (2002) 3,366,723
19. PS2 (2001) 3.246.138
20. PS2 (2003) 3.211.975
21. 3DS (2014) 3.153.045
22. PSP (2007) 3,022,659
23. PS2 (2000) 3,016,622 (launch / weeks of data)
24. DS (2010) 2,963,709
25. PS1 (1999) 2.927.856
26. WII (2008) 2,908,342
27. PSP (2010) 2,890,476
28. PS2 (2004) 2.729.237
29. PS1 (1996) 2.689.095
30. GBA (2004) 2.436.106
31. PSP (2009) 2,307,971
32. GBC (1999) 2.261.756
33. PSP (2005) 2,225,799
34. 3DS (2015) 2.189.900
35. GBC (2000) 2,097,899
36. PS2 (2005) 2.020.184
37. WII (2009) 1,975,178
38. PSP (2011) 1,960,177
39. PSP (2006) 1,946,911
40. PS4 (2017) 1.935.247
41. 3DS (2016) 1.874.457
42. 3DS (2017) 1.827.131
43. PS4 (2016) 1.790.883
44. WII (2010) 1,728,293
45. PS3 (2009) 1,727,041
46. PS4 (2018) 1.695.227
47. PS3 (2010) 1,558,480
48. PS2 (2006) 1.470.654
49. PS3 (2011) 1,467,261
50. PS1 (1995) 1.370.000
51. PS3 (2012) 1,327,185
52. N64 (1998) 1.208.070
53. PS3 (2007) 1,206,347
54. PS4 (2015) 1.205.163
55. PSV (2013) 1,197,980
56. GBA (2005) 1.197.061
57. GC (2003) 1.155.122
58. PSV (2014) 1.147.938
59. N64 (1999) 1.131.605
60. DS (2004) 1,095,930 (launch / 4 weeks of data)
61. GC (2002) 1,034,484
62. PS3 (2008) 991,303
63. WII (2006) 989,118 (launch / 5 weeks of data)
64. PSV (2015) 959.342
65. PSP (2012) 941,992
66. WII (2011) 937,451
67. N64 (1996) 933.480 (launch / weeks of data)
68. SDC (1999) 932.761
69. GC (2001) 925,924 (launch / weeks of data)
70. PS4 (2014) 925.570 (launch / weeks of data)
71. N64 (1997) 919.269
72. WIU (2013) 880,088
73. GBC (1998) 855.175
74. PSV (2016) 865.002
75. PS3 (2013) 824,167
76. WIU (2015) 820.304
77. PS2 (2007) 816,419
78. DS (2011) 711,204
79. PSV (2012) 674,365
80. WIU (2012) 638,339 (launch / 4 weeks of data)
81. WIU (2014) 604.856
82. PS1 (2000) 581,260
83. 3DS (2018) 566.420
84. GC (2004) 535.961
85. GBC (2001) 529.452
Note: Missing Famitsu Data from "Game Data Library"
Note! The Nintendo Switch sales are pretty comparable to the 6th Gen top performers.
GBA and PS2 both launched in march. After year 4 the GBA sales faltered quickly because of the DS launch while the PS2 was an evergreen console.
Nintendo noted that they want to extend the life for the Switch for as long as possible. This is in line with Nintendos recent efforts to extend the life of the 3DS although this was quite a diffcult task due to its already at launch dated hardware and its low screen resolution. The 3DS hardware was never valued highly by consumers hence the early price cut. In contrast to the 3DS the Switch hardware is appreciated by consumers and with its screen consumers can enjoy cinematic experiences.
For these reasons i think the NSW sales should be measured by the PS2 sales because they were steady and the PS2 was long supported.There is also no other way for the Switch to achieve 20 million console sales in japan. The last two years the Switch achieved good results reaching nearly the same levels as the PSP in their best year on the back of the Monster Hunter hype.
In the next year the Switch should achieve between 3.732.020 and 3.833.980 sales as the PS2 and the GBA did, below is bad and above is good. The 3DS achieved 4,931,509 sales in its third year but as I explained above the 3DS should be (hopefully) more fontloaded than the Switch.
Next year could also be the peak year for the Switch so hopefully the NSW gets into the top 10 of the chart below. The NSW needs to sell 4,025,313 units at minimum. The best case would be to outperform place 7 with 4,200,311 units sold.
Comparison GBA/PS2/NSW:
Launch dates:
NSW: March 3, 2017
PS2: March 4, 2000
GBA: March 21, 2001
GBA:
Year 1: 4.210.317
Year 2: 3,366,723
Year 3: 3.833.980
Year 4: 2.436.106
Year 5: 1.197.061
Year 6: 407.341
PS2:
Year 1: 3,016,622
Year 2: 3.246.138
Year 3: 3.732.020
Year 4: 3.211.975
Year 5: 2.729.237
Year 6: 2.020.184
Year 7: 1.470.654
Year 8: 816,419
Year 9: 480,664
NSW:
Year 1: 3.407.158
Year 2: 3,400,000
PSP:
Year 1: 339,944
Year 2: 2,225,799
Year 3: 1,946,911
Year 4: 3,022,659
Year 5: 3,543,171
Year 6: 2,307,971
Year 7: 2,890,476
Year 8: 1,960,177
Year 9: 941,992
Year 10: 429,393
OP
OP
Promotion likely happened for PS4 hitting internal targets since sales had dropped to very low levels before December. If it did its work and from the moment it didn't had any serious impact at selling software there was no reason to continue.Should have kept at least price promotion going on until the big hitters release (KH and RE) to maximise their hw moving potential. oh well.
It's not an online multiplayer game, its sales won't hit a wall because of a new entry in the series. Super Mario Galaxy sold 30% of its LTD sales (3.89m/12.78m) after the launch of its sequel, and (non-bundled/non-Wii series) Wii games like SMG didn't have legs nearly as good as Switch games like BotW.I don't see it reaching 20M if there is indeed a 3D Zelda in 2020 (King Zell hinted at this). If that's not the case, then it might have a chance, but even then, that sounds a little high: it's an evergreen, but one that sells much less than others (especially less than MK8D)
BotW on Switch rn is probably around 12 million shipped and will be at over 16 (maybe even 17 or 18) million by December 2019, before "BotW2".
Last edited:
OP
OP
PS4 biggest disadvantage this year isn't the end of promotion but the lack of titles that can push hardware.
I count only KH3 and RE2 but even combined they are far from the bump MHW gave to PS4 in January and February.
Like i said week 2 drop will give a very good idea of what to expect this quarter.
I count only KH3 and RE2 but even combined they are far from the bump MHW gave to PS4 in January and February.
Like i said week 2 drop will give a very good idea of what to expect this quarter.
How big would The Last of Us 2 be in Japan ? The first one seemed to have sold close to 400k combined, do we expect a lower or a higher number for TLOU2 ?PS4 biggest disadvantage this year isn't the end of promotion but the lack of titles that can push hardware.
I count only KH3 and RE2 but even combined they are far from the bump MHW gave to PS4 in January and February.
Like i said week 2 drop will give a very good idea of what to expect this quarter.
KH fanbase should be on PS4 already. Traditional RE fanbase maybe not so much.
why not? 7 and PS4 ports for 0,1,4,5,6 are already available.
Yeah, maybe. I was just thinking about cutting cost and cutting size a bit too(like right now, not in 2 years, the 3DS buyers are left out of the water without a new revision so why not make a small switch instead?). Transporting the switch and joycons seperately doesn't sound so great either. I haven't used my Switch outside my home very often, because of its size. I carried my Vita around me(mainly with P4G loaded) quite a lot in the past, even though it was one of the larger handhelds it was a lot smaller than the Switch.It's not like a 3DSXL or 2DS are pocketable as-is (I know you were comparing OG GBA but even that isn't super duper portable) but those did alright. Taking the joycons off makes the switch super easy to carry around and a lot smaller so a version with fixed joycons would be less portable than it currently is.
I'm on the boat thinking you keep making this version of the Switch but cut the price 50-100 bucks and get a new Switch out with a better processor for $300. It makes the most logical sense.
Could you keep the Wii in the graphs still, I think that would be interesting to watch, at least for another year or so?Next Switch comparison will be with PS2.
I will start it in March, until then I will keep Wii. It's not time for 3DS yet.
True but RE ports are non-events these days and RE7 wasn't really a traditional RE game (it didn't sell much after all). KH ports were kept selling well on PS4.
OP
OP
These are last of Us sales in JapanHow big would The Last of Us 2 be in Japan ? The first one seemed to have sold close to 400k combined, do we expect a lower or a higher number for TLOU2 ?
2013 CY {2012.12.31 - 2013.12.29} 041. [PS3] The Last of Us <ADV> (Sony Computer Entertainment) {2013.06.20} (¥5.696) - 222.328 / 222.328
2014 CY {2013.12.30 - 2014.12.28} 181. [PS3] The Last of Us <ADV> (Sony Computer Entertainment) {2013.06.20} (¥5.696) - 41.096 / 263.424
2015 CY {2014.12.29 - 2016.01.03} 000. [PS3] The Last of Us <ADV> (Sony Computer Entertainment) {2013.06.20} (¥5.696) - 957 / 264.381
2016 CY {2016.01.04 - 2017.01.01} 000. [PS3] The Last of Us <ADV> (Sony Computer Entertainment) {2013.06.20} (¥5.696) - 27 / 264.408
2017 CY {2017.01.02 - 2017.12.31} 000. [PS3] The Last of Us <ADV> (Sony Computer Entertainment) {2013.06.20} (¥5.696) - 2 / 264.410
2015 CY {2014.12.29 - 2016.01.03} 269. [PS3] The Last of Us [PlayStation 3 the Best] <ADV> (Sony Computer Entertainment) {2015.01.22} (¥3.800) - 19.347 / 19.347
2016 CY {2016.01.04 - 2017.01.01} 820. [PS3] The Last of Us [PlayStation 3 the Best] <ADV> (Sony Computer Entertainment) {2015.01.22} (¥3.800) - 1.727 / 21.073
2017 CY {2017.01.02 - 2017.12.31} 998. [PS3] The Last of Us [PlayStation 3 the Best] <ADV> (Sony Computer Entertainment) {2015.01.22} (¥3.800) - 917 / 21.991
2014 CY {2013.12.30 - 2014.12.28} 135. [PS4] The Last of Us Remastered <The Last of Us \ The Last of Us: Left Behind> <ADV> (Sony Computer Entertainment) {2014.08.21} (¥5.900) - 59.638 / 59.638
2015 CY {2014.12.29 - 2016.01.03} 311. [PS4] The Last of Us Remastered <The Last of Us \ The Last of Us: Left Behind> <ADV> (Sony Computer Entertainment) {2014.08.21} (¥5.900) - 16.573 / 76.211
2016 CY {2016.01.04 - 2017.01.01} 240. [PS4] The Last of Us Remastered <The Last of Us \ The Last of Us: Left Behind> <ADV> (Sony Computer Entertainment) {2014.08.21} (¥5.900) - 20.657 / 96.868
2017 CY {2017.01.02 - 2017.12.31} 314. [PS4] The Last of Us Remastered <The Last of Us \ The Last of Us: Left Behind> <ADV> (Sony Computer Entertainment) {2014.08.21} (¥5.900) - 11.044 / 107.912
It's still unknown when the game will be out, it could go higher from the first. If you ask if it will push hardware it won't.
02./02. [NSW] Super Mario Party # <ETC> (Nintendo) {2018.10.05} (¥5.980) - 95.102 / 936.140 (-4%)
Nintendo should shift this franchise to tier 1 and favor less and more quality releases for the Mario Party franchise. The sales of "Super Mario Party" prove that the franchise was mismanaged for a very long time. Even this new entry of Super Mario Party lacks content in comparison to games like Super Smash Bros. Ultimate. So I assume a more quality release of this franchise could have done much better.
Could you keep the Wii in the graphs still, I think that would be interesting to watch, at least for another year or so?
I will shift NDS with PS2.
NDS is so high that is above the limit of the graph, so it makes little sense to keep it.
I could also make the graph bigger to keep NDS, but then it would look too small, so I prefer to remove it (also its sales are unreachable so it makes sense).
OP
OP
Much better than what Super Mario Party is doing everywhere isn't possible.Nintendo should shift this franchise to tier 1 and favor less and more quality releases for the Mario Party franchise. The sales of "Super Mario Party" prove that the franchise was mismanaged for a very long time. Even this new entry of Super Mario Party lacks content in comparison to games like Super Smash Bros. Ultimate. So I assume a more quality release of this franchise could have done much better.
It will be over 5m last quarter.
Wait sub 20k next week for ps4?Agreed, Probably will be sub 20k already.
I'm not expecting a big bump for KH3 and RE2 either. Around ~50k.
Exactly. The same way switch hasn't affected the ps4 support.I don't really think the PS5 is going to affect Switch support by Japanese developers in any meaningful way.
Smash Ultimate and Splatoon 2 closing in on 3M. Crazy.
I wonder how long Mario Odyssey will take to reach 2M?
I wonder how long Mario Odyssey will take to reach 2M?
Probably cause the awesome deal they had ends after last week.Wait sub 20k next week for ps4?
Exactly. The same way switch hasn't affected the ps4 support.
Super Smash Bros, the Monster Hunter hunter
Nintendo should shift this franchise to tier 1 and favor less and more quality releases for the Mario Party franchise. The sales of "Super Mario Party" prove that the franchise was mismanaged for a very long time. Even this new entry of Super Mario Party lacks content in comparison to games like Super Smash Bros. Ultimate. So I assume a more quality release of this franchise could have done much better.
Even filler titles in the franchise sold pretty good---also, budget is not very high so they can release a Mario Party every two year easily.
Breath of the Wild Switch in this graph actually includes Switch and Wii U numbers, last we know Switch BotW is at 10.28 million at the end of Semptember 2018.
The others are not combined sales of releases and re-releases, so this graph is a little bit misleading. Whats true is that Switch BotW is the single best selling Zelda release with 10.28 million, followed by Twilight Princess. Highest combined Zelda with rerelease is Orcarina of time with 13.22 million.
Still absolutely stellar franchise growth.
So the world wide chase for BotW is 13.22 million. Then it will be the undisputed leader in the Zelda franchise sales race, for any possible comparison combination.
BTW, are there any charts on how the ratios are divided historically between the sales regions for the main entries in the Nintendo franchises? For example: how is BotW doing in Japan relatively to the rest of the world, compared to Twilight Princess?
I'm not gonna lie, going from 117k to sub 20k would be really disappointing especially with 3 good games coming in January. AC7, RE2 and KH3.Probably cause the awesome deal they had ends after last week.
Okay. Why is media create tracking switch significantly lower than the other two? 30k lower in week 51, 10+k lower in week 52, and now 47k lower than dengeki at least for week 1. That's an 87k discrepancy in a matter of 3 weeks.
I'm curious about this too. That's a lot.
01./01. [NSW] Super Smash Bros. Ultimate # <FTG> (Nintendo) {2018.12.07} (¥7.200) - 258.974 / 2.614.160 (-6%)
02./02. [NSW] Super Mario Party # <ETC> (Nintendo) {2018.10.05} (¥5.980) - 95.102 / 936.140 (-4%)
03./03. [NSW] Pokemon: Let's Go, Pikachu! / Let's Go, Eevee! # <RPG> (Pokemon Co.) {2018.11.16} (¥5.980) - 68.308 / 1.399.595 (+4%)
04./04. [NSW] Mario Kart 8 Deluxe <RCE> (Nintendo) {2017.04.28} (¥5.980) - 55.758 / 2.055.899 (+33%)
06./06. [NSW] Splatoon 2 # <ACT> (Nintendo) {2017.07.21} (¥5.980) - 43.033 / 2.882.819 (+40%)
11./10. [NSW] The Legend of Zelda: Breath of the Wild # <ADV> (Nintendo) {2017.03.03} (¥6.980) - 19.363 / 1.246.656 (+27%)
12./13. [NSW] Super Mario Odyssey # <ACT> (Nintendo) {2017.10.27} (¥5.980) - 16.896 / 1.931.675 (+35%)
14./14. [NSW] Kirby Star Allies <ACT> (Nintendo) {2018.03.16} (¥5.980) - 14.769 / 717.643 (+35%)
16./18. [NSW] Mario Tennis Aces <SPT> (Nintendo) {2018.06.22} (¥5.980) - 10.468 / 411.002 (+35%)
19./24. [NSW] Captain Toad: Treasure Tracker <ADV> (Nintendo) {2018.07.13} (¥3.980) - 7.718 / 177.872
Smash might run away with it this gen unless there's a last good Splatoon DLC that helps it maintain its top spot.