OP is updated, graphs are at the bottom of this post.
Moderators, for archival purposes I request that you do not merge this thread to someone else's.
2nd Quarter Results link: https://www.nintendo.co.jp/ir/pdf/2017/171030e.pdf
Switch hardware forecast increased to 14M units from 10M originally.
Switch software forecast increased to 50M units from 35M originally.
Hardware sales units: https://www.nintendo.co.jp/ir/en/finance/hard_soft/index.html
Top selling software units: https://www.nintendo.co.jp/ir/en/finance/software/index.html
Net Sales: ¥374,041 million (~$3.29 billion), 173.4% increase YoY
Operating Income: ¥39,961 million (~$351 million)
Profit: ¥51,503 million (~$453 million)
I have picked statements from the summary for this post, check for more details of the summary at the first link:
Splatoon 2 did 3.61M units for the quarter.
Amiibo numbers are mentioned, but not SNES Mini Classic:
As mentioned, Switch hardware forecast revised upwards to 14 million and Switch software forecast revised upwards to 50M:
72.8% of net sales came from outside Japan:
Nintendo Switch
Hardware: 2.93 million for the quarter/ 4.89 million FYTD /7.63 million LTD
Software: 13.98 million for the quarter/ 22.02 FYTD/27.58 million LTD (Only counts Digital software that has a retail version)
3DS
Hardware: 1.91 million for the quarter/ 2.86 FYTD/68.98 million LTD
Software: 7.97 million for the quarter/ 13.82 FYTD/343.07 million LTD
Smart Device, IP related income: ¥17,925 million (~$158 million FYTD)
Nintendo's earnings share from Pokémon Go:
(Share of profit of entities accounted for using equity method:) ¥6,429 million (~$57 million FYTD)
For the above two, Smart Device, Pokémon Go, Nintendo is earning a lot more money from their own smartphone games compared to Pokémon Go.
(For comparison, Smart Device, IP related income for all of FY3/2017 was: ¥24,250 million
Income from Pokémon Go for all of FY3/2017 was: ¥20,271 million)
Switch Hardware shipments WW:
Japan - 1.95 million LTD
The Americas - 3.11 million LTD
Other - 2.56 million LTD
Switch Hardware shipments WW LTD by %:
Japan - 25.6%
The Americas - 40.8%
Other - 33.6%
https://twitter.com/mochi_wsj/status/924903180269260801
https://twitter.com/mochi_wsj/status/924950252037160960
Update:
The following except for the last graph are YoY comparisons for the quarter.
YoY comparison of the quarter. You can barely see Nintendo's operating income last FY.
Geographical Sales breakdown, this is one of the graphs that separates Europe from Other:
Sales breakdown by category:
Geographical breakdown of Nintendo Switch sales specifically, as mentioned it separates Europe from Other:
Edit:
Top selling title sales units as of September 30, 2017
Switch
The Legend of Zelda: Breath of the Wild -
4.70 million pcs.
Mario Kart 8 Deluxe - 4.42 million pcs.
Splatoon 2 - 3.61 million pcs.
1-2-Switch - 1.37 million pcs.
ARMS - 1.35 million pcs.
Wii U
Mario Kart 8 - 8.38 million pcs.
New Super Mario Bros U - 5.73 million pcs.
Super Mario 3D World - 5.70 million pcs.
Super Smash Bros. for Wii U - 5.26 million pcs.
Nintendo Land - 5.18 million pcs.
Splatoon - 4.87 million pcs.
Super Mario Maker - 3.98 million pcs.
New Super Luigi U - 2.99 million pcs.
The Legend of Zelda: The Wind Waker HD - 2.23 million pcs.
Mario Party 10 - 2.13 million pcs.
3DS
Pokémon X/Pokémon Y - 16.20 million pcs.
Mario Kart 7 - 15.95 million pcs.
Pokémon Sun/Pokémon Moon - 15.91 million pcs.
Pokémon Omega Ruby/Pokémon Alpha Sapphire - 13.85 million pcs.
New Super Mario Bros. 2 - 11.73 million pcs.
Super Mario 3D Land - 11.40 million pcs.
Animal Crossing: New Leaf - 11.23 million pcs.
Super Smash Bros. for Nintendo 3DS - 8.91 million pcs.
Tomodachi Life - 5.93 million pcs.
Luigi's Mansion: Dark Moon - 5.45 million pcs.
DS
Animal Crossing: Wild World -
11.75 million pcs.
Moderators, for archival purposes I request that you do not merge this thread to someone else's.
2nd Quarter Results link: https://www.nintendo.co.jp/ir/pdf/2017/171030e.pdf
Switch hardware forecast increased to 14M units from 10M originally.
Switch software forecast increased to 50M units from 35M originally.
Hardware sales units: https://www.nintendo.co.jp/ir/en/finance/hard_soft/index.html
Top selling software units: https://www.nintendo.co.jp/ir/en/finance/software/index.html
Net Sales: ¥374,041 million (~$3.29 billion), 173.4% increase YoY
Operating Income: ¥39,961 million (~$351 million)
Profit: ¥51,503 million (~$453 million)
I have picked statements from the summary for this post, check for more details of the summary at the first link:
Splatoon 2 did 3.61M units for the quarter.
During the six months ended September 30, 2017, for Nintendo Switch, Splatoon 2 released in July gained popularity both in Japan
and overseas, with 3.61 million units sold globally. Mario Kart 8 Deluxe and ARMS also both sold well after their releases in April and
June, respectively. All told, the sales volume for the Nintendo Switch hardware and software during this period came to 4.89 million
units and 22.02 million units respectively.
Amiibo numbers are mentioned, but not SNES Mini Classic:
In addition, Super Nintendo Entertainment System: Super NES Classic Edition was off to a good start following its September
launch (launched on October 5 in Japan). We also made moves to expand our amiibo line, by launching the new Splatoon series amiibo.
Our amiibo sales were approximately 5.10 million units for figure-type and approximately 2.80 million units for card-type.
As mentioned, Switch hardware forecast revised upwards to 14 million and Switch software forecast revised upwards to 50M:
We have revised the financial forecast originally published on April 27, 2017. For details, see the Notice of Full-Year Financial
Forecast Modifications issued today (October 30, 2017).
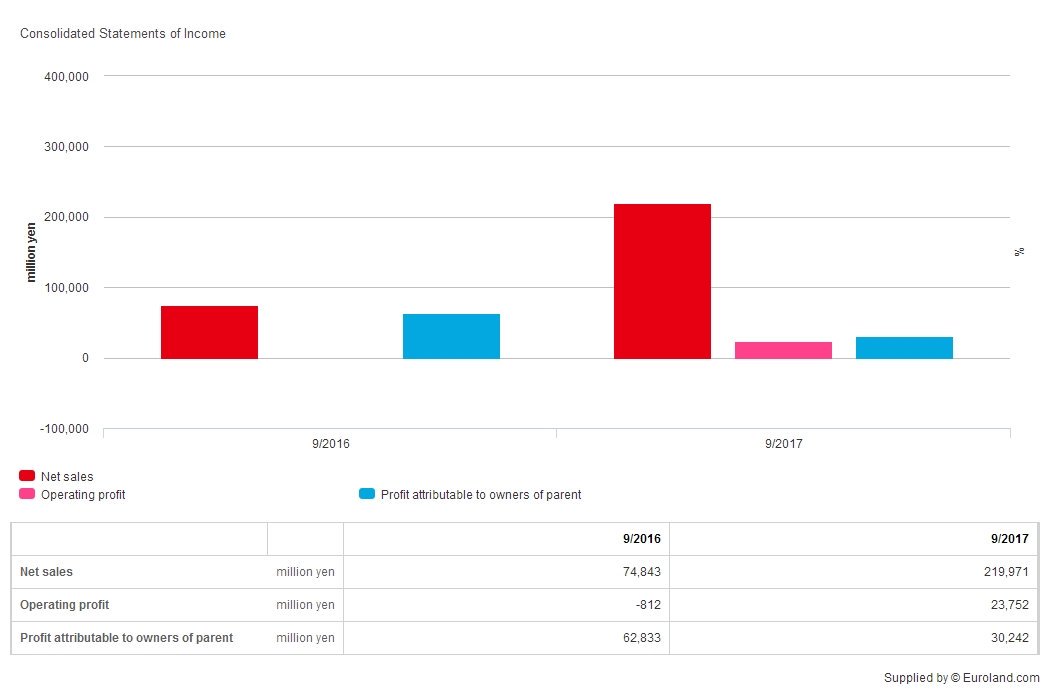
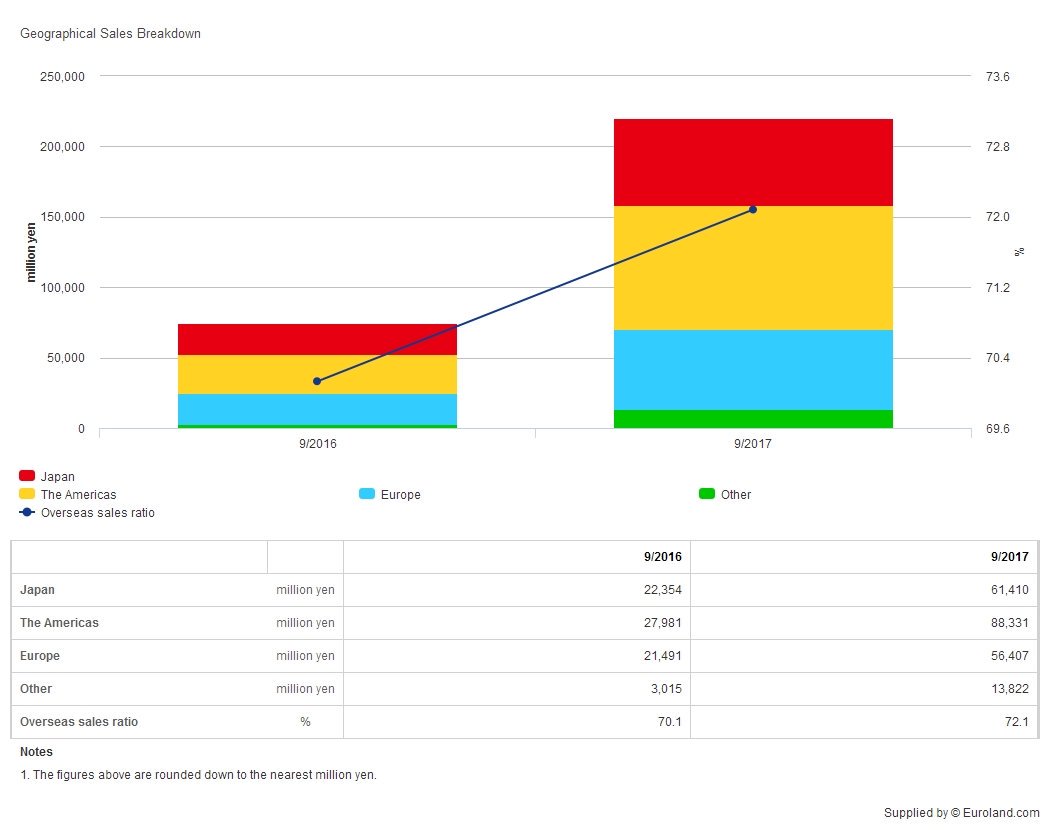
72.8% of net sales came from outside Japan:
With this background, our total sales reached 374.0 billion yen (of which overseas sales were 272.3 billion yen or 72.8% of the total
sales). Operating profit came to 39.9 billion yen, ordinary profit was 69.5 billion yen, and profit attributable to owners of parent
reached 51.5 billion yen.
Nintendo Switch
Hardware: 2.93 million for the quarter/ 4.89 million FYTD /7.63 million LTD
Software: 13.98 million for the quarter/ 22.02 FYTD/27.58 million LTD (Only counts Digital software that has a retail version)
3DS
Hardware: 1.91 million for the quarter/ 2.86 FYTD/68.98 million LTD
Software: 7.97 million for the quarter/ 13.82 FYTD/343.07 million LTD
Smart Device, IP related income: ¥17,925 million (~$158 million FYTD)
Nintendo's earnings share from Pokémon Go:
(Share of profit of entities accounted for using equity method:) ¥6,429 million (~$57 million FYTD)
For the above two, Smart Device, Pokémon Go, Nintendo is earning a lot more money from their own smartphone games compared to Pokémon Go.
(For comparison, Smart Device, IP related income for all of FY3/2017 was: ¥24,250 million
Income from Pokémon Go for all of FY3/2017 was: ¥20,271 million)
Switch Hardware shipments WW:
Japan - 1.95 million LTD
The Americas - 3.11 million LTD
Other - 2.56 million LTD
Switch Hardware shipments WW LTD by %:
Japan - 25.6%
The Americas - 40.8%
Other - 33.6%

https://twitter.com/mochi_wsj/status/924903180269260801
Nintendo CEO says there will be more ways to have fun with Switch, details to be announced next year
https://twitter.com/mochi_wsj/status/924950252037160960
Nintendo said it shipped 1.7 million units of SNES Classic as of Sept. 30.
Update:
The following except for the last graph are YoY comparisons for the quarter.
YoY comparison of the quarter. You can barely see Nintendo's operating income last FY.
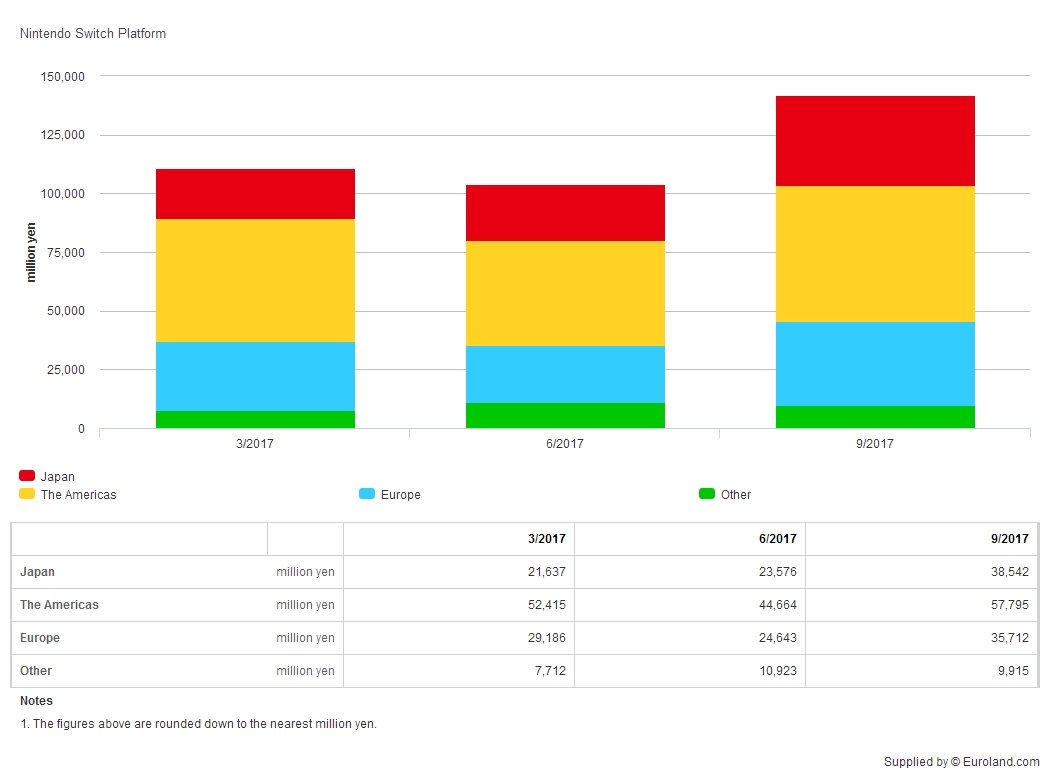
Geographical Sales breakdown, this is one of the graphs that separates Europe from Other:
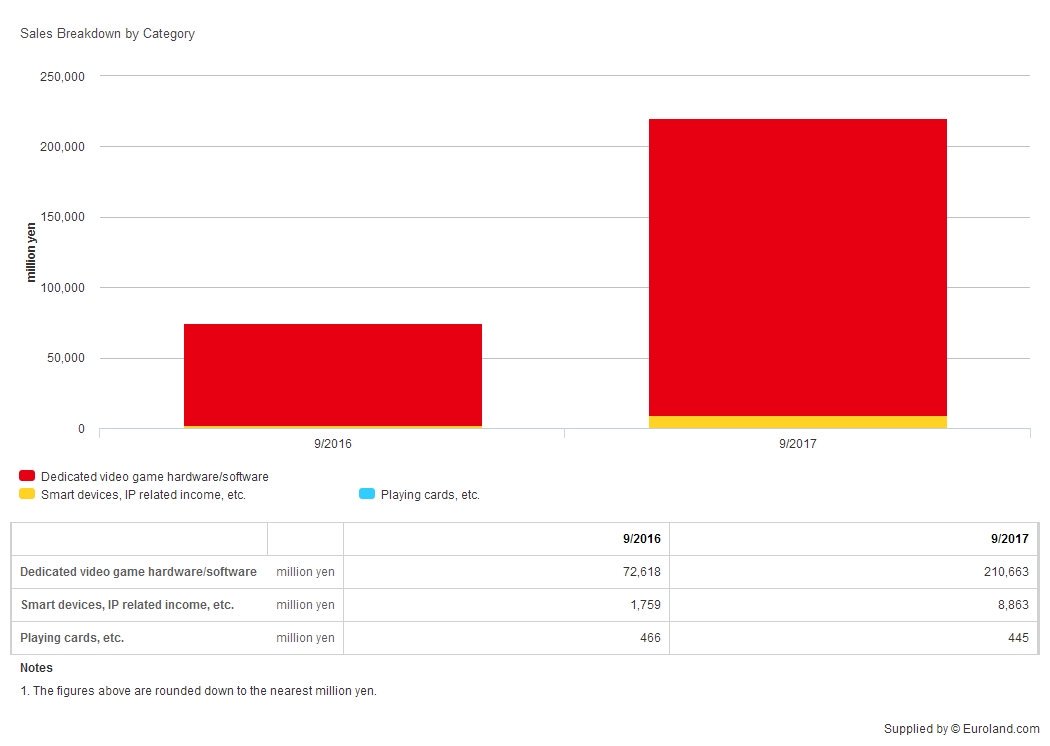
Sales breakdown by category:
Geographical breakdown of Nintendo Switch sales specifically, as mentioned it separates Europe from Other:
Edit:
Top selling title sales units as of September 30, 2017
Switch
The Legend of Zelda: Breath of the Wild -
4.70 million pcs.
Mario Kart 8 Deluxe - 4.42 million pcs.
Splatoon 2 - 3.61 million pcs.
1-2-Switch - 1.37 million pcs.
ARMS - 1.35 million pcs.
Wii U
Mario Kart 8 - 8.38 million pcs.
New Super Mario Bros U - 5.73 million pcs.
Super Mario 3D World - 5.70 million pcs.
Super Smash Bros. for Wii U - 5.26 million pcs.
Nintendo Land - 5.18 million pcs.
Splatoon - 4.87 million pcs.
Super Mario Maker - 3.98 million pcs.
New Super Luigi U - 2.99 million pcs.
The Legend of Zelda: The Wind Waker HD - 2.23 million pcs.
Mario Party 10 - 2.13 million pcs.
3DS
Pokémon X/Pokémon Y - 16.20 million pcs.
Mario Kart 7 - 15.95 million pcs.
Pokémon Sun/Pokémon Moon - 15.91 million pcs.
Pokémon Omega Ruby/Pokémon Alpha Sapphire - 13.85 million pcs.
New Super Mario Bros. 2 - 11.73 million pcs.
Super Mario 3D Land - 11.40 million pcs.
Animal Crossing: New Leaf - 11.23 million pcs.
Super Smash Bros. for Nintendo 3DS - 8.91 million pcs.
Tomodachi Life - 5.93 million pcs.
Luigi's Mansion: Dark Moon - 5.45 million pcs.
DS
Animal Crossing: Wild World -
11.75 million pcs.
Last edited: